The Challenge
The Management team at a Large 700,000 square foot Car Manufacturing Plant (“The Plant”) needed the data to measure all impact events occurring in the Plant by its fleet operation on a day-to-day basis, in real time. The ultimate vision was to build systems to be proactive and reduce overall maintenance costs on 30 of these expensive corporate assets.
The vision and success factors for this project were as follows:
-
Measure: Seamlessly “Data Log” every Impact Event for future analysis – without human intervention. This data gives management at the plant ability to understand “today”, and manage the “tomorrow” by measuring the Impact Events occurring in the Plant on a day-to-day basis, in real-time.
-
Educate: Implement an audible buzzer into the solution. The intent of the solution was not to be “Big Brother”, but rather to educate THE operator when impacts occurred and explain proper operational procedures. The vision of this project was not to “reprimand” an operator, but rather to raise operator awareness through education when issues occur.
-
Reduce: With seamless data logging and supporting education, the vision was ultimately to reduce overall maintenance costs of the fleet being monitored.
The Solution
The following diagram provides a high level overview of the overall technical architecture of the BolerWireless.com solution. The selected technical architecture has proven to be highly reliable and consistent in reporting impact events anywhere in the plant. The communication backbone incorporated into the solution includes a high speed GPRS/GPS network.
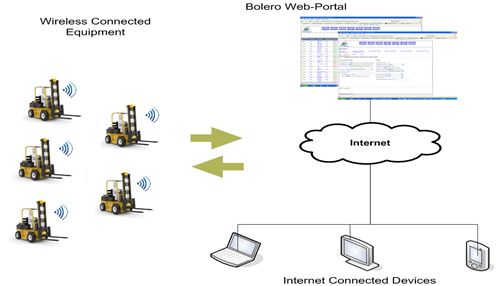
The Components
In this solution, all thirty (30) Lift trucks have been installed with the Impact Monitoring solution made up of the following components
- Impact Alert module including 1.5g Sensor and audible Buzzer;
- Bolero Wireless GPRS/GPS Wireless Modem configured as a Monitor/Alert platform;
- A 10 second buzzer is sounded letting the Operator know an impact was recorded;
- A cellular GPRS message is sent to the cellular Network and lands in the Bolero back-end;
- The Event is logged real-time in the Bolero database and Bolero Live! Web Portal.
The Results
In summary, the overall trend has been a steady positive decrease in the impacts recorded during the reporting period. From looking at the data aggregated across all departments, Impact events went from 196 impact (an average of 6.75) event recorded during the month of March, 2012 down to 78 (an average of 2.68) impact events recorded during the month of September, 2012. This represents an overall reduction of 60% in the number of impacts recorded by the solution during this reporting period.
The Impact Data by Plant by Month data is depicted in the following graph:
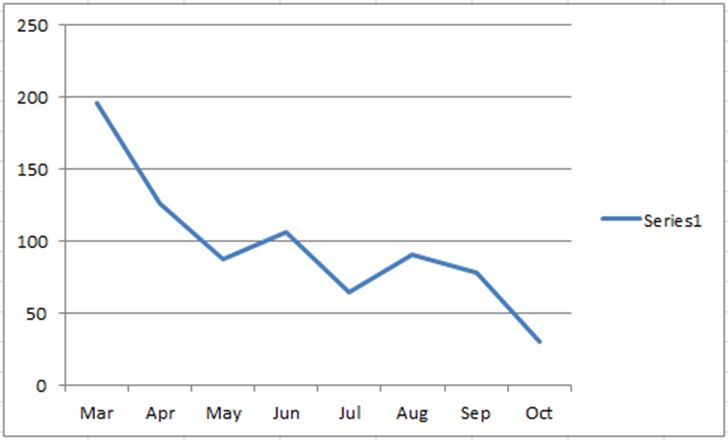
As can be seen by the preceding graph, the trend is consistently downward from month to month with the overall trend of recorded Impact Events moving downwards. As of October 18, 2012 at 12:00 noon, the number of impacts that have occurred in the plant in October are currently down to 35. Based on this data, it is anticipated that the overall number of impacts in October will be around 70 and potentially the lowest month yet since the installation of the Impact monitoring solution at the Polycon Plant.
After speaking with the Plant Manager, the overall trend on maintnance costs is also on the downward trend. The plant was spending on average $100,000 annually on Lift Truck maintenance. As of the end of October, the overall spend on Lift Truck Maintenance was down to $30,000! It can be safely said that this project has had an overall positive impact on the Plant, and more importantly, improving Safety for all Plant staff.